Each year, statistical employment information is gathered on our undergraduate and MBA programs and published in aggregate form. Edwards Career Services tracks all of our graduates up to six months post graduation. For our B.Comm program, the current year statistics will be published by early December. For the MBA program, statistics will be published in May of the following year.
Employers can find more demographic information on the University's Student Headcount and Demographics page.
Section 1
B.Comm. Graduate Employment Results
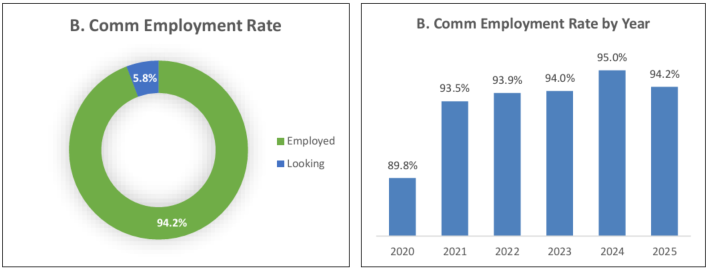
| BComm Grad | 2020 | 2021 | 2022 | 2023 | 2024 | 2025 |
|---|---|---|---|---|---|---|
| Employed | 89.8% | 93.5% | 93.9% | 94.0% | 95.0% | 94.2% |
| Looking | 10.2% | 6.5% | 6.1% | 4.0% | 5.0% | 5.8% |
| Response Rate | 88.2% | 84.7% | 84.8% | 82.9% | 83.1% | 82.0% |
Section 2
B.Comm. Employment Results with Co-op Option
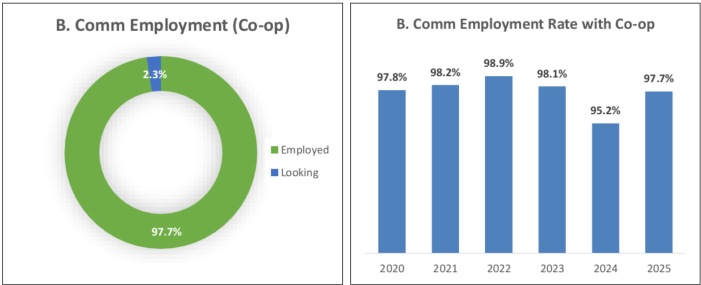
| BComm Grad | 2020 | 2021 | 2022 | 2023 | 2024 | 2025 |
|---|---|---|---|---|---|---|
| Employed | 97.8% | 98.2% | 98.9% | 98.1% | 95.2% | 97.7% |
| Looking | 2.2% | 1.8% | 1.1% | 1.9% | 4.8% | 2.3% |
Section 3
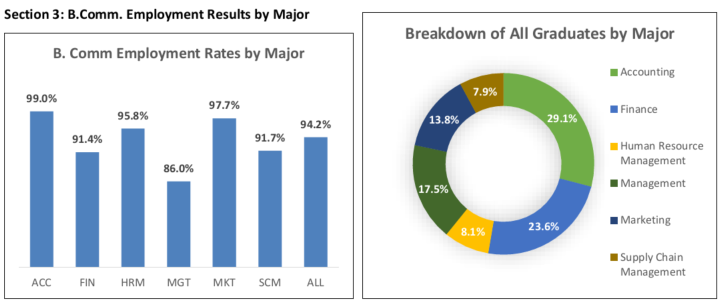
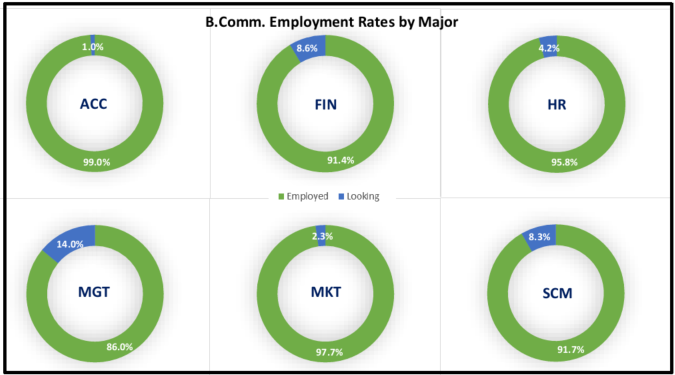
B.Comm. Employment Results by Major
| Major | Actual Number of Graduates (Fall/Spring) |
Overall Response Rate by Major | Employment Rate By Major |
|||
| Frequency | % | Frequency | % | Frequency | % | |
| Accounting | 118 | 29.1% | 106 | 89.8% | 100/101 | 99.0% |
| Finance | 96 | 23.6% | 74 | 77.1% | 64/70 | 91.4% |
| HR | 33 | 8.1% | 28 | 84.8% | 23/24 | 95.8% |
| Management | 71 | 17.5% | 53 | 74.6% | 43/50 | 86.0% |
| Marketing | 56 | 13.8% | 47 | 83.9% | 42/43 | 97.7% |
| Operations Managment | 32 | 7.9% | 25 | 78.1% | 22/24 | 91.7% |
| Total | 406 | 100% | 333 | 82.0% | 294/312 | 94.2% |
Section 4
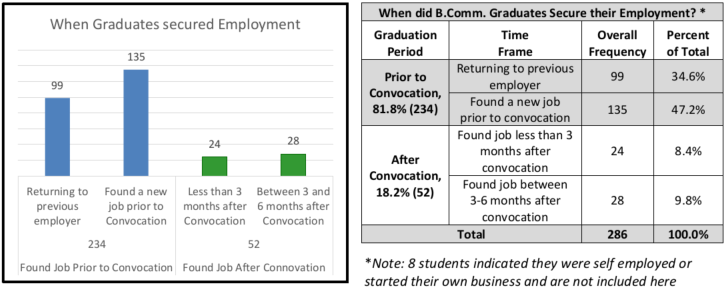
When did Employed B. Comm. Graduates Secure their Employment?
| When did B.Comm. Grads Secure Employment by Major | ||||||||
|---|---|---|---|---|---|---|---|---|
| Major | Secured Employment Prior to Convocation |
Secured Employment After Convocation |
||||||
| Returned to prior job | Found new job | Less than 3 months | Between 3-6 months | |||||
| Accounting | 48.0% | 42.0% | 5.0% | 5.0% | ||||
| Finance | 26.7% | 48.3% | 11.7% | 13.3% | ||||
| HR | 39.1% | 47.8% | 4.3% | 8.7% | ||||
| Management | 23.8% | 47.6% | 16.7% | 11.9% | ||||
| Marketing | 28.2% | 51.3% | 7.7% | 12.8% | ||||
| Operations Management/ Supply Chain Management | 22.7% | 59.1% | 4.5% | 13.6% | ||||
| All Grads | 34.6% | 47.2% | 8.4% | 9.8% | ||||
| Overall | 81.8% secured jobs prior to graduation | 18.2% secured jobs after graduation | ||||||
Section 5
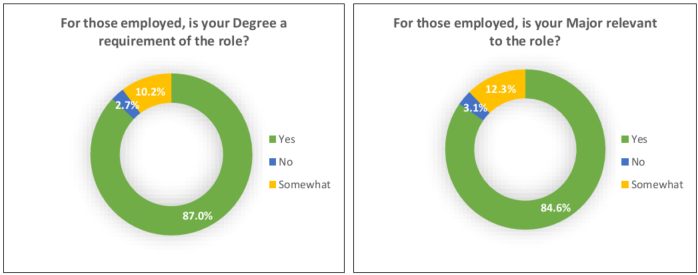
Relevance to the Job Role for B.Comm. Degree and for Major of Graduate
Section 6
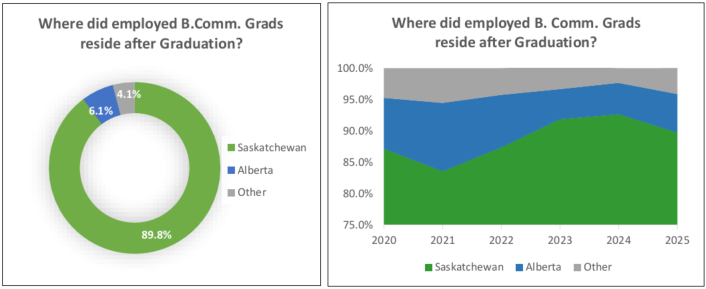
Location of Employed B.Comm. Graduates
|
Breakdown of Location of B.Comm. Graduates by Year
|
||||||
| Province | 2020 | 2021 | 2022 | 2023 | 2024 | 2025 |
| Saskatchewan | 87.2% | 83.6% | 87.4% | 91.1% | 92.7% | 89.8% |
| Alberta | 8.1% | 10.0% | 8.4% | 4.8% | 5.0% | 6.1% |
| BC | 2.2% | 2.9% | 2.7% | 1.0% | 0.7% | 1.4% |
| Manitoba | 0.7% | 0.6% | 0.0% | 0.3% | 0.3% | 1.4% |
| Eastern Canada | 1.5% | 1.3% | 0.8% | 2.0% | 0.7% | 1.0% |
| Outside of Canada | 0.3% | 0.3% | 0.8% | 0.7% | 0.7% | 0.3% |
| Breakdown of Location of B.Comm. Graduates by Year | ||||||||
|---|---|---|---|---|---|---|---|---|
| Major | Saskatchewan | Alberta | Rest of Canada | Outside Canada | ||||
| # | % | # | % | # | % | # | % | |
| Accounting | 91 | 91.0% | 6 | 6.0% | 3 | 3.0% | 0 | 0.0% |
| Finance | 57 | 89.1% | 4 | 6.3% | 2 | 3.2% | 1 | 1.6% |
| HR | 22 | 95.7% | 1 | 4.3% | 0 | 0.0% | 0 | 0.0% |
| Management | 41 | 95.3% | 2 | 4.7% | 0 | 0.0% | 0 | 0.0% |
| Marketing | 35 | 83.3% | 4 | 9.5% | 3 | 7.2% | 0 | 0.0% |
| Operations Management | 18 | 81.8% | 1 | 4.5% | 3 | 13.6% | 0 | 0.0% |
| Total | 264 | 89.8% | 18 | 6.1% | 11 | 3.8% | 1 | 0.3% |
| Location of Employed B.Comm. Graduates by Major: Saskatchewan compared with Alberta | ||||||||||||
| Major | 2020 | 2021 | 2022 | 2023 | 2024 | 2025 | ||||||
| SK | AB | SK | AB | SK | AB | SK | AB | SK | AB | SK | AB | |
| Accounting | 89.3% | 9.3% | 85.9% | 9.1% | 88.2% | 10.5% | 91.1% | 6.9% | 93.9% | 5.1% | 91.0% | 6.0% |
| Finance | 83.8% | 13.5% | 78.2% | 16.4% | 85.1% | 10.6% | 88.2% | 5.9% | 89.1% | 9.1% | 89.1% | 6.3% |
| HR | 86.2% | 3.4% | 88.9% | 11.1% | 95.2% | 4.8% | 91.2% | 2.9% | 89.2% | 5.4% | 95.7% | 4.3% |
| Management | 90.5% | 5.4% | 84.0% | 8.0% | 85.1% | 9.0% | 94.1% | 2.0% | 98.0% | 0.0% | 95.3% | 4.7% |
| Marketing | 79.4% | 11.8% | 82.8% | 10.3% | 97.9% | 3.0% | 87.5% | 5.0% | 90.0% | 7.5% | 83.3% | 9.5% |
| Operations Management | 87.3% | 4.2% | 76.5% | 17.6% | 88.9% | 5.6% | 100.0% | 0.0% | 95.2% | 0.0% | 81.8% | 4.5% |
Section 7
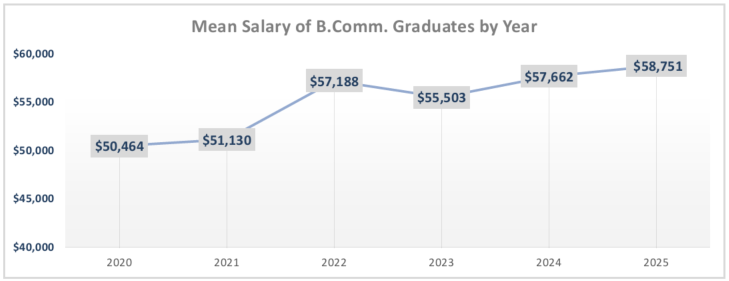
Mean Salary of Employed B.Comm. Graduates by Major and by Year
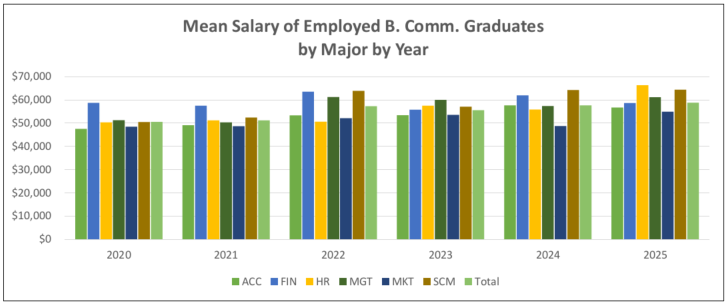
| Major | 2020 | 2021 | 2022 | 2023 | 2024 | 2025 | ||||||
| # | Mean | # | Mean | # | Mean | # | Mean | # | Mean | # | Mean | |
| Accounting | 49 | $47,527 | 47 | $49,082 | 46 | $53,239 | 48 | $53,344 | 54 | $57,645 | 62 | $56,649 |
| Finance | 19 | $58,657 | 22 | $57,452 | 23 | $63,513 | 24 | $55,744 | 24 | $61,922 | 25 | $58,624 |
| HR | 16 | $50,231 | 16 | $51,152 | 12 | $50,503 | 19 | $57,458 | 26 | $55,843 | 9 | $66,333 |
| Management | 36 | $51,207 | 22 | $50,247 | 29 | $61,182 | 16 | $59,996 | 26 | $57,267 | 25 | $61,152 |
| Marketing | 16 | $48,375 | 13 | $48,615 | 13 | $52,038 | 14 | $53,526 | 15 | $48,667 | 16 | $54,875 |
| Operations Management | 14 | $50,371 | 7 | $52,417 | 10 | $63,800 | 11 | $57,000 | 13 | $64,160 | 12 | $64,357 |
| Total | 150 | $50,464 | 127 | $51,130 | 133 | $57,188 | 132 | %55,503 | 152 | $57,662 | 149 | $58,751 |
Section 8
Industry of Employed B.Comm. Graduates
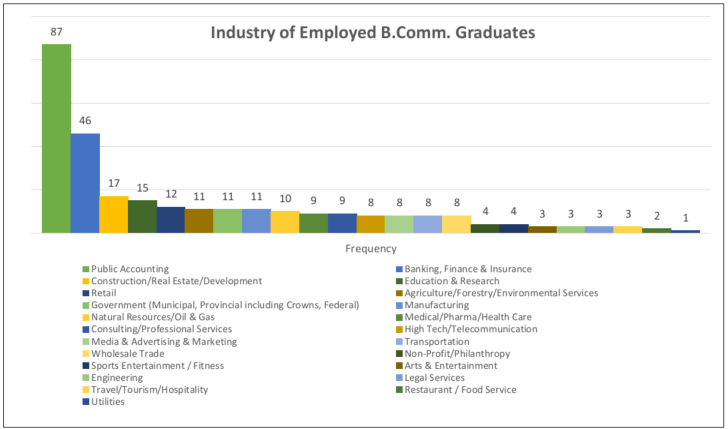
| Industry | # | % | Industry | # | % | Industry | # | % |
| Public Accounting | 87 | 29.7 | Natural Resources, Oil & Gas | 10 | 3.4 | Sports Entertainment & Fitness | 4 | 1.4 |
| Banking, Insurance & Finance | 46 | 15.7 | Medical, Pharma & Health Care | 9 | 3.1 |
Arts & Entertainment |
3 | 1.0 |
| Construction & Real Estate/Development | 17 | 5.8 | Consulting & Professional Services | 9 | 3.1 | Engineering | 3 | 1.0 |
| Education & Research | 15 | 5.1 | High Tech & Telecommunications | 8 | 2.7 | Legal Services | 3 | 1.0 |
| Retail, Sales & Consumer Services | 12 | 4.1 | Media, Advertising & Marketing | 8 | 2.7 | Travel, Tourism & Hospitality | 3 | 1.0 |
| Agriculture, Forestry & Environmental | 11 | 3.8 | Transportation | 8 | 2.7 | Restaurant & Food Services | 2 | 0.7 |
| Government | 11 | 3.8 | Wholesale Trade | 8 | 2.7 | Utilities | 1 | 0.3 |
| Manufacturing | 11 | 3.8 | Non-Profit & Philanthropy | 4 | 1.4 | Total | 293 | 100.0% |
Section 9
Mean Salary of Employed B.Comm. Graduates by Industry, and by Industry & Year
| Industry | Salary | Industry | Salary | Industry | Salary |
| Public Accounting | $55,390 | Consulting & Professional Services | $57,500 | Travel/Tourism/Hospitality | $25,000 |
| Banking, Finance & Insurance | $56,642 | Wholesale Trade | $57,600 | Restaurant & Food Service | $56,000 |
| Government Agencies & Crowns | $66,108 | Manufacturing | $64,600 | Golf Courses & Country Clubs | n/a |
| Retail, Sales & Consumer Goods | $64,167 | Media & Advertising & Marketing | $52,500 | Sports Entertainment & Fitness | $63,500 |
| Agriculture, Forestry & Environmental Services | $58,125 | Transportation | $60,000 | Non-Profit & Philanthropy | $50,555 |
| Medical, Pharma & Health Care | $50,250 | Natural Resources & Oil & Gas | $70,450 | High Tech/Telecommunications | $58,167 |
| Construction, Real Estate & Development | $71,474 | Education & Research | $68,667 | Engineering | n/a |
| Mean Salary of Employed B.Comm. Graduates by Industry and Year | ||||||||||
| Industry | 2021 | 2022 | 2023 | 2024 | 2025 | |||||
| Count | Salary | Count | Salary | Count | Salary | Count | Salary | Count | Salary | |
| Agriculture, Forestry & Environmental Services | 9 | $53,480 | 7 | $67,857 | 4 | $57,500 | 4 | $63,750 | 8 | $58,125 |
| Arts & Entertainment | - | - | 1 | $55,800 | - | - | - | - | - | |
| Banking, Finance & Insurance | 53 | $50,902 | 19 | $56,421 | 18 | $52,061 | 21 | $60,345 | 19 | $56,642 |
| Construction & Real Estate | 14 | $58,000 | 6 | $68,000 | 2 | $61,000 | 6 | $61,600 | 8 | $71,474 |
| Consulting & Professional Services | 6 | $47,500 | 6 | $72,333 | 2 | $58,500 | 4 | $48,500 | 5 | $57,500 |
| Education & Research | 7 | $61,333 | 3 | $92,667 | 8 | $53,700 | 3 | $62,667 | 6 | $68,667 |
| Engineering | 5 | $43,120 | - | - | - | - | 2 | $60,500 | - | - |
| Golf & Country Clubs | 2 | $50,000 | - | - | - | - | 1 | $45,500 | - | - |
| Government Agencies & Crowns | 23 | $56,641 | 17 | $58,964 | 12 | $54,753 | 17 | $62,918 | 6 | $66,108 |
| High Tech & Telecom | 20 | $48,250 | 5 | $54,900 | 4 | $61,750 | 3 | $58,167 | ||
| Information Services | 9 | $40,000 | - | - | 4 | $51,440 | - | - | - | - |
| Legal Services | 2 | $60,000 | 1 | $50,000 | - | - | - | - | ||
| Manufacturing | 7 | $67,5000 | 3 | $53,333 | 4 | $47,500 | 3 | $66,667 | 7 | $64,600 |
| Media, Advertising & Marketing | 8 | $45,500 | 4 | $47,690 | 5 | $44,800 | 1 | $45,000 | 2 | $52,500 |
| Medical,Pharma & Health Care | 7 | %55,587 | 8 | $59,954 | 5 | $68,810 | 8 | $61,125 | 3 | $50,250 |
| Natural Resources, Mining, Oil & Gas | 8 | $51,250 | 5 | $58,820 | 5 | $74,740 | 7 | $73,643 | 5 | $70,450 |
| Non-Profit & Philanthropy | 3 | $48,000 | - | - | 5 | $63,706 | 6 | $43,525 | 2 | $50,555 |
| Public Accounting | 77 | $45,633 | 31 | $49,355 | 37 | $52,162 | 35 | $54,671 | 59 | $55,390 |
| Restaurant & Food Services | 2 | - | 1 | $25,000 | 1 | $45,000 | 2 | $40,500 | 1 | $56,000 |
| Retail, Sales & Consumer Goods | 28 | $49,500 | 5 | $54,056 | 8 | $57,115 | 8 | $53,688 | 6 | $64,167 |
| Sports Entertainment & Fitness | 3 | - | 2 | $38,000 | - | - | 1 | $40,000 | 2 | $63,500 |
| Transportation | - | - | 5 | $46,310 | 3 | $47,667 | 4 | $49,445 | 1 | $60,000 |
| Travel, Tourism & Hospitality | 1 | $60,000 | - | - | 2 | $62,080 | 3 | $48,000 | 1 | $25,000 |
| Wholesale Trade | 12 | $58,914 | 4 | $74,750 | 7 | $68,357 | 8 | 59,885 | 5 | $57,600 |
| Other | 6 | $45,500 | - | - | - | - | 3 | 54,200 | - | - |
Section 10
Comparison of Employed B.Comm. Graduates by Major and Industry
| Major and Industry of Employed B.Comm. Graduates by Major and Industry | ||||||||
| Industry | ACC | FIN | HR | MGT | MKT | OM/SCM | Total | % |
| Agriculture/Forestry/Environmental Services | 1 | 1 | 1 | 4 | 4 | 0 | 11 | 3.8% |
| Arts & Entertainment | 0 | 0 | 2 | 0 | 1 | 0 | 3 | 1.0% |
| Banking, Finance & Insurance | 1 | 34 | 2 | 9 | 0 | 0 | 46 | 15.7% |
| Medical/Pharma/Health Care | 1 | 3 | 0 | 3 | 1 | 1 | 9 | 3.1% |
| Construction/Real Estate/Development | 2 | 5 | 2 | 0 | 5 | 3 | 17 | 5.8% |
| Consulting/Professional Services | 1 | 0 | 2 | 3 | 2 | 1 | 9 | 3.1% |
| Education & Research | 3 | 1 | 2 | 3 | 4 | 2 | 15 | 5.1% |
| Engineering | 0 | 2 | 0 | 0 | 0 | 1 | 3 | 1.0% |
| Government (Municipal, Provincial including Crowns, Federal) | 1 | 1 | 2 | 3 | 2 | 2 | 11 | 3.8% |
| High Tech / Telecommunications | 0 | 0 | 0 | 0 | 7 | 1 | 8 | 2.7% |
| Legal Services | 0 | 1 | 0 | 0 | 2 | 0 | 3 | 1.0% |
| Manufacturing | 0 | 0 | 3 | 4 | 2 | 3 | 11 | 3.8% |
| Media & Advertising & Marketing | 1 | 0 | 0 | 1 | 6 | 0 | 8 | 2.7% |
| Non-Profit & Philanthropy | 0 | 0 | 1 | 1 | 2 | 0 | 4 | 1.4% |
| Natural Resources / Oil & Gas | 1 | 2 | 1 | 3 | 0 | 3 | 10 | 3.4% |
| Public Accounting | 83 | 3 | 0 | 1 | 0 | 0 | 97 | 29.7% |
| Restaurant / Food Service | 0 | 1 | 1 | 0 | 0 | 0 | 2 | 0.7% |
| Retail, Sales & Consumer Goods | 1 | 3 | 1 | 4 | 1 | 2 | 12 | 4.1% |
| Sports Entertainment / Fitness | 0 | 0 | 1 | 2 | 1 | 0 | 4 | 1.4% |
| Transportation | 1 | 1 | 3 | 1 | 0 | 2 | 8 | 2.7% |
| Travel/Tourism/Hospitality | 1 | 1 | 0 | 0 | 0 | 1 | 3 | 1.0% |
| Wholesale Trade | 2 | 3 | 0 | 1 | 2 | 0 | 8 | 2.7% |
| Utilities | 0 | 1 | 0 | 0 | 0 | 0 | 1 | 0.3% |
| Total | 100 | 63 | 23 | 43 | 42 | 22 | 293 | 100% |
Section 11
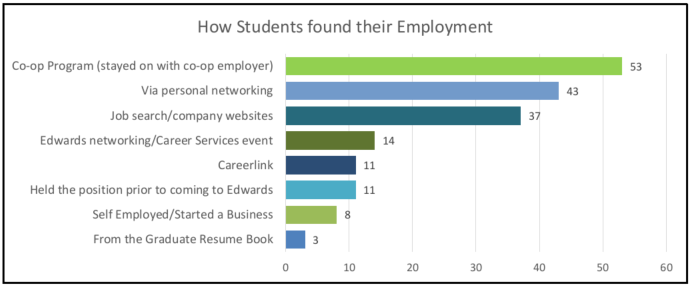
How Employed B.Comm. Graduates found Employment
| Breakdown of Location of B.Comm. Graduates by Year | ||
| Method | Frequency | Percent |
| Through the Co-op Program (Stayed on with co-op employer) | 53 | 29.4% |
| Through a job search website other than CareerLink (including company websites and LinkedIn) | 37 | 20.6% |
| Via Personal Networking | 43 | 23.9% |
| Through an Edwards networking / Career Services event (Edwards Connect, hallway visits, etc) | 14 | 7.8% |
| Held the position prior to coming to Edwards | 11 | 6.1% |
| CareerLink | 11 | 6.1% |
| Started a business or self employed | 8 | 4.4% |
| From the Graduate Resume Book | 3 | 1.7% |
| Total | 188 | 100% |
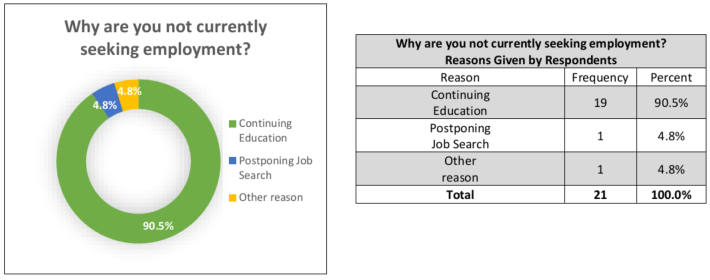
Section 12
For Students not Currently Seeking Employment – Reasons Given